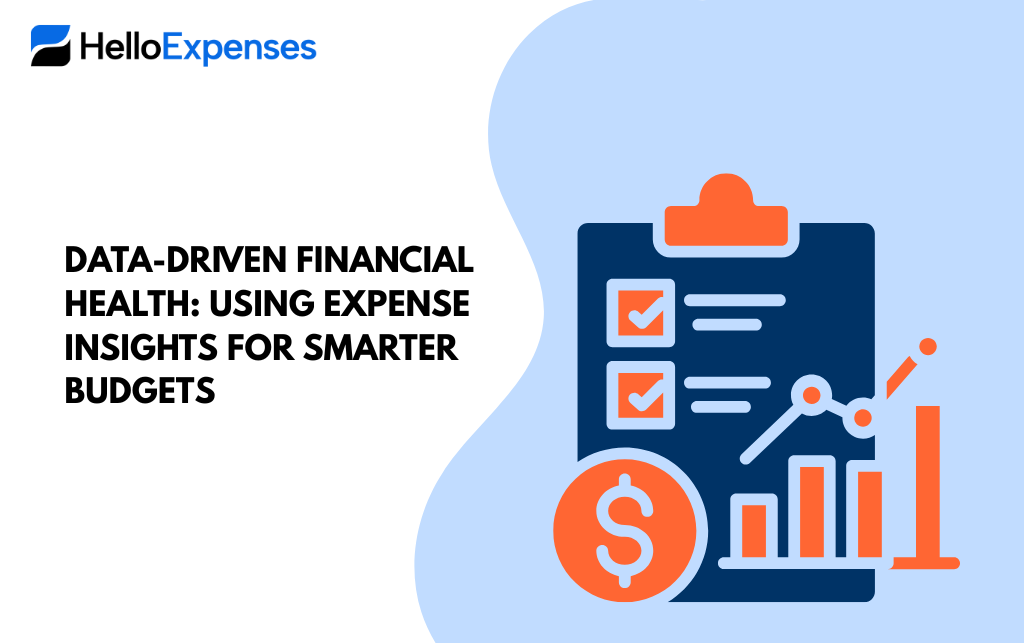
A well-built personal or organizational budget is not just a shot in the dark with good intentions. “Data-driven budgeting helps turn raw expense information into actionable insights, so you can spend resources strategically, identify potential cash flow problems before they happen and track progress against financial objectives,” Crawford said. This article covers how to Identify patterns in your spending, establish measurable goals and rely on insights from spending to continually update more sensible budgets.
Why data-driven budgeting matters
Trusting intuition or making one-off snapshots of accounts, however, can mean recurring problems are camouflaged: creeping subscription costs, seasonal revenue shortfalls or one-off expenses that distract from underlying trends. Evidence-based budgeting is that it breaks the cycle of basing budgets on assumptions. By tracking, categorizing and analyzing your spending over time to identify trends you can see what’s normal, uncover anomalies, start focusing on where costs can be reduced and model out scenarios that demonstrate the real trade offs in your budget.
Key benefits
- Visibility: Know where money is being spent on a granular level.
- Predictability: Rely on past trends to make predictions about future spending and cash flow.
- Accountability Establish measurable goals and objective measures to monitor progress.
- Rationalization: Find wasteful spending and shift the resources to high-growth areas.
Building the foundation: collecting and preparing expense data
You cannot have a strong budget without accurate data. Focus on these fundamentals:
Data collection
Aggregate Detail-Level Transactions for all Budgeting Accounts. This can be bank transactions, credit expenses or any sort of recurring payout. Consistency is key: The more complete and consistent your data, the truer your insights will be.
Data cleaning and categorization
Original transaction data frequently has bad description fields. Match merchant names and address information, break out bundled transactions (for instance, a single bill for multiple services), and remove duplicates. Create a specific category taxonomy—necessities, variable spending, discretionary expenses, one-time investments—to run consistent comparisons on.
Enriching data
Attach any labels or tags that are relevant to your context: department, project, vendor type or even purpose of your spending. These dimensions open up further analysis and finer budget allocations.
Turning expense insights into smarter budgets
When you have clean, categorized data, then go from description to action.
Identify trends and seasonality
Compare spending between months or quarters. Find out what the peaks are for your business, (e.g. higher utility costs in winter or increased marketing spends during a launch quarter) and make allowances for them in your budgeting cycle. Seasonal adjustments can be the difference between surprise shortfalls and those known, last-minute fixes.
Measure financial health with metrics
Establish a few critical financial health metrics and use them to drive decisions. Useful examples include:
- Monthly spend on average in each category
- Discretionary vs. fixed spend as a percentage
- Cash runway (reserve months of operating expenses)
- Budget vs Actual Spend Variance
Monitor these metrics to see how the financial health is improving or declining overtime.
Prioritize based on impact
Not all costs are equal. Score the categories by impact and flexibility based on insights on expenses. For example, vendor contracts are high impact and low flexibility while subscription services are low impact and high flexibility. Focus on the high-cost, high-flexibility categories to optimize first.
Set data-informed targets
Turn the insights into concrete, measurable budget goals. Instead of an amorphous goal, like “cut costs,” aim for something specific: “decrease discretionary spending by 8% over six months” or “extend cash runway by two months within the next year.” These goals are robust to evaluate and encourage persistent feedback.
Operational practices for sustainable budgeting
Sustainable financial wellness is achieved through disciplined routines that weave data into decision cycles.
Regular review cadence
Create monthly and quarterly budget checks. Monthly reviews can capture aberrations in the short term and allow fast correction; quarterly reviews are better for strategic adjustments and scenario planning.
Root-cause analysis for variances
When spend no longer adheres closely to the plan, do a root cause analysis. Was there a spike caused by a one-time event, an unbudgeted recurring cost or a structural change in demand? Filter out the noise from the signal so that you do not overreact.
Use scenario planning
Construct low, medium and high scenarios by taking into account expense trends and external drivers. Scenario planning brings out how changes — in revenues, costs (inflation) — translate into changes to runway and funding needs, and prioritizes contingency plans.
Create feedback loops
Ask team members to submit what everyone has been spending their money on. A budget that develops based on frontline feedback is more achievable and doable. Codify lessons learned after each review cycle and refine category definitions or targets as needed.
Practical techniques to extract more value from expense data
Rolling averages and trend lines
Smooth the short-term volatility with rolling averages to see the underlying trends. And perhaps directionality is more detectable in a three- or six-month rolling average than it would be month by month.
Spend concentration analysis
Key areas of spend to vendors, categories or projects. High volume could signal risks of dependence or bargaining power.
Unit-cost analysis
Then come up with unit costs (cost per user, cost per project, or the like) for variable costs associated with production or service delivery. Monitoring unit costs is useful for profitability and pricing services in a manner that is reasonable.
Heat maps and visual dashboards
Visualizations —heat maps for category intensity, dashboards for key metrics— make these patterns available to stakeholders and expedite the decision-making process.
Common pitfalls and how to avoid them
- Overfitting to outliers: Avoid overfitting your budget permanently to occasional spikes.
- Too much metric’ing: Concentrate on a couple of high-impact metrics to avoid analysis paralysis.
- Forgetting qualitative context: Marry data with operational insights; the numbers only tell part of the story, but context helps explain why.
- Late updates: Stale data is no longer relevant. Try to have the pick-up and analysis of samples done within a reasonable timeframe.
Getting started checklist
- Obtain itemized transactions for the previous one year.
- Clean and classify the transactions with a well-defined taxonomy.
- Create 3–5 financial health metrics and baseline them.
- Establish clear budget goals from what you’ve learned about expenses.
- Block off monthly and quarterly review times with your stakeholders.
- Develop some simple scenario plans and build at least one visual dashboard.
Conclusion
Data-based budgeting turns expense information into a strategic asset. Once you start sourcing dependable data, establishing vivid categories, and determining financial health through focused metrics, you can construct more intelligent budgets–ones that are anticipatory, agile and linked to long-term objectives. Budgets remain relevant and resilient with regular review, scenario planning, and an emphasis on high-impact changes. Think small, err on the side of clarity over complexity, and use expensive learnings to fuel incremental progress toward financial health.
Frequently Asked Questions (FAQs)
AI combines optical character recognition and machine learning to extract details from receipts and invoices, adapt to varied formats, and reduce manual data entry errors, improving overall accuracy.
Key metrics include average processing time per expense, cost per transaction, exception rate, policy compliance rate, and time saved for finance staff to quantify savings and impact.